Mapping and Reporting
Study Geographic Markets with Map Visualizations and Reports
Get a Demo
Easily study markets with our one-stop-shop for geographic market insights
Tell the story of a market faster with user-friendly map illustrations and reports
Answer macro-level business questions about your location network and markets
Make more informed strategic decisions backed by population and market data
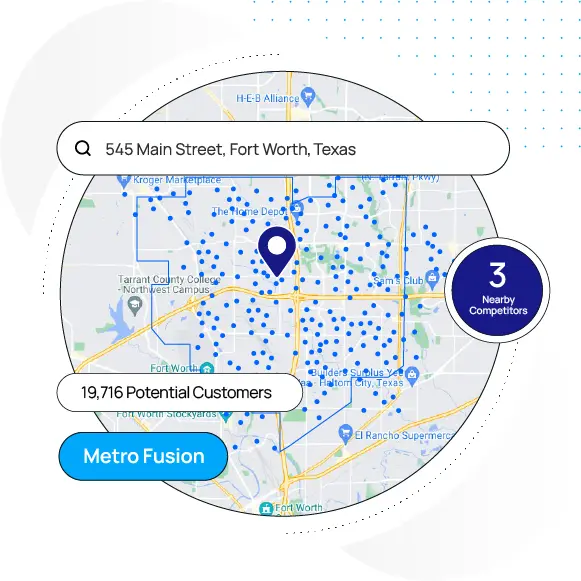
Visualize data in user-friendly maps
As the old saying goes, a picture is worth a thousand words. Create maps using Buxton’s demographic, consumer lifestyle, boundary, points of interest, and business location datasets, or upload your own locations, territories, and pushpin data to illustrate market dynamics.
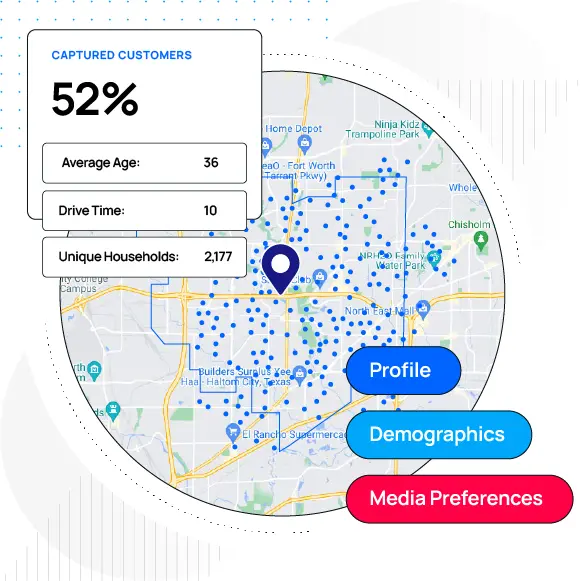
Run reports to better understand markets
Create custom reports in minutes by mixing and matching Buxton datasets. Whether you’re evaluating sites, showcasing territory potential, or supporting long-term strategic planning, our configurable reporting gives you unmatched flexibility to deliver the insights you need for any geography.
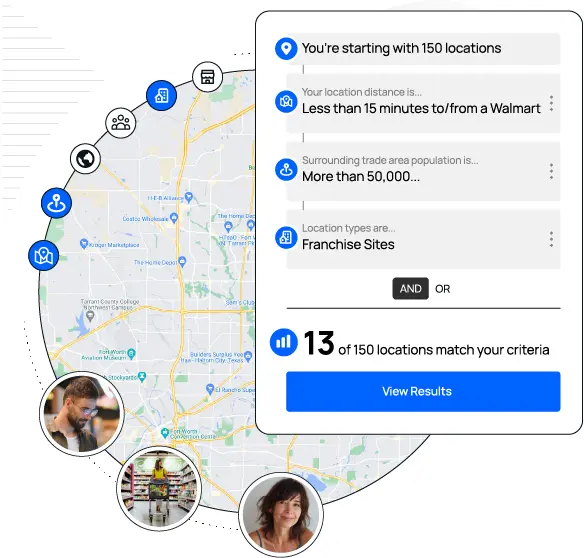
Answer questions with user-friendly queries
Leverage the power of Buxton’s database combined with an intuitive query builder that doesn’t require advanced training. Discover answers about geographic areas out of the box or integrate with our mapping tool to study your locations.
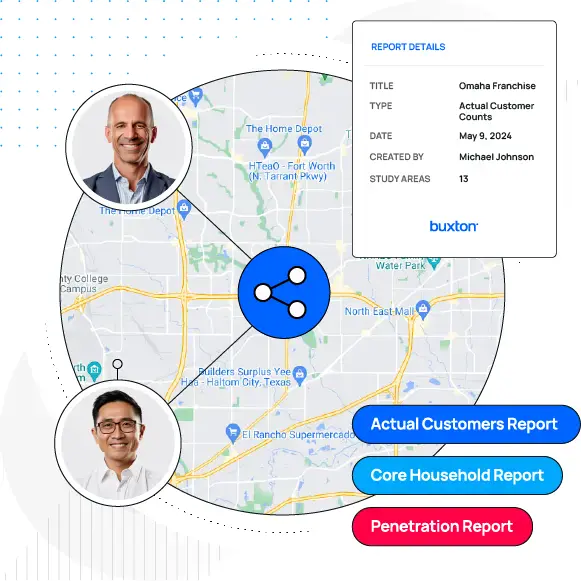
Share custom map views and reports
Found the answer? We make it easy to share your analysis with colleagues and other stakeholders. Generate a share link for custom map views, print maps to PDF or PNG files, or download reports and query results in a variety of formats for easy printing and sharing.
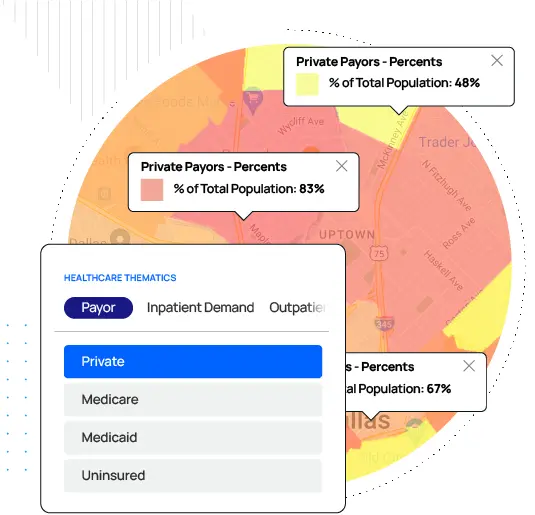
Dive deeper into factors that influence healthcare strategy
Healthcare users round out their subscription with a specialized healthcare data package, which adds essential insights on payor mix, demand, supply, and social determinants of health. Map and report on critical factors for your industry.
Leading Brands Trust