https://www.buxtonco.com/images/core-icons/navigation-location-portfolio-audit.svgLocation Optimization Analysis

Improve Existing Location Performance

Get a demo
https://www.buxtonco.com/images/copy-image/mast-portfolio-audit_1.webp

Get more out of your existing brick-and-mortar locations

https://www.buxtonco.com/images/core-icons/icon-portfolio-audit-ROI-Brick-Mortar-2c.svg

Maximize the return on every brick-and-mortar location in your network

https://www.buxtonco.com/images/core-icons/icon-infill-market-2c.svg

Optimize resource allocation by pinpointing the locations that will benefit from further investment

https://www.buxtonco.com/images/core-icons/icon-customer-value.svg

Rally your teams around a common understanding of your customer base to turn around performance

Customer Persona Insights

Use customer insights to design strategies to improve performance

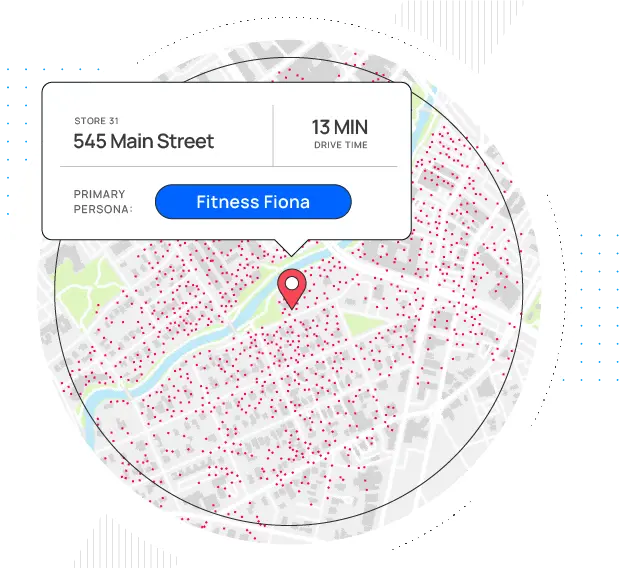
Brick-and-mortar is a critical channel for many B2C organizations. The challenge facing management teams is how to maximize the return on that channel investment. Use Buxton’s location-level customer persona insights to understand which customer types are in the immediate trade area of a location, their preferred marketing channels, and more, so you can design customer-centric strategies to maximize performance.

  • Create customer-centric strategies in marketing, merchandising, and more using insights from Buxton’s customer personas
  • Arm your marketing team with in-depth customer insights to optimize store-level marketing campaigns
  • Inform troubleshooting conversations with local operators using customer and trade area insights
  • Illustrate the consumer dynamics around each location by mapping households that match your personas in Buxton’s mapping and reporting tool

Performance Benchmarking

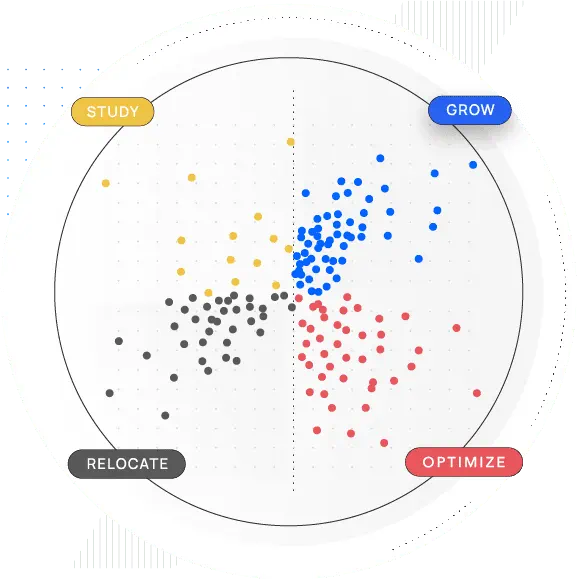
Benchmark current portfolio performance

Buxton’s portfolio audit provides insights into how your brick-and-mortar locations are performing and where further investment is likely to yield results to fuel your decision making. We use your Buxton site score model to score your current locations and then compare the score to actual performance to look for gaps. The auditing process groups your locations into four segments so you can quickly prioritize where to invest your time and resources.

  • Identify locations that aren’t meeting their potential so you can get them back on track
  • Spot poor-performing locations without much upside potential to find candidates for closure or relocation
  • Use unbiased, third-party analytics to guide conversations with operations teams

Alternative Options for Healthcare

Optimize service line mix with a facility assessment

Healthcare organizations who have subscribed to Buxton’s industry models may opt for a specialized audit that assesses the potential to add new service lines to current facilities. Know the optimal service line mix for each facility.

Buxton Intelligence

The Power Behind Our Location Optimization Solutions

Location optimization analysis is powered by Buxton’s unique blend of data, analytics, and AI backed by our 30 years of analytics expertise. Harness our intelligence to maximize the performance of your brick-and-mortar locations.

  • https://www.buxtonco.com/images/core-icons/icon-buxton-ai-white-outline.svg Buxton Data Matrix
  • https://www.buxtonco.com/images/core-icons/icon-analytics-white-outline.svg Buxton Analytics
  • https://www.buxtonco.com/images/core-icons/icon-buxton-data-white-outline.svg Buxton AI

Leading Brands Trust

CityMD Urgent Care Logo
Anthropologie Logo
Octapharma Plasma Logo
Tumi Logo
Xpress Wellness Urgent Care Logo
Urban Outfitters Logo
Children’s Healthcare of Atlanta Logo
Red Wing Shoes Logo
At Home Logo
Medstar Health Alt Logo
Restoration Hardware Logo
Advent Health Logo
Fabletics Logo
Kendra Scott Logo
https://www.buxtonco.com/images/customer-quotes/red-wing-shoes-testimonial%402x.webp
"In doing the optimization piece, we’re able to understand which stores should be relocated, which stores should be closed and then where can we add new stores to see the tide waters of that market grow even more."
01
/
03

Frequently Asked Questions

How does Buxton define a location optimization analysis?

Buxton defines location optimization analysis as a broad category of analyses designed to guide decisions about how to maximize the performance of each brick-and-mortar location in the organization's network. This may include identifying locations that aren't meeting their full performance potential, identifying possible underlying causes for poor performance, and/or identifying steps the organization could take to optimize the peformance of their brick-and-mortar locations.

What data does Buxton use for location optimization analysis?

The data Buxton uses for location optimization analysis varies based on the version of the analysis you select. All analysis starts with understanding customer potential around the location and taps into Buxton's household-level consumer datasets. More advanced analysis also taps into location data for competitors and cotenants, datasets identified as correlating with your business performance, and your own performance data. Healthcare location optimization analyses are often designed to optimize the service line mix at multi-specialty facilities and tap into specialized healthcare datasets.

How does location optimization analysis support strategic decision-making?

Location optimization analysis gives context to business decisions about what steps to take at specific locations. Without it, decisions are based solely on internal financial and operational metrics and may miss important opportunities. For example, a poor-performing location surrounded by high concentrations of core customer households can and should be approached differently than a poor-performing location that lacks the required core customer density. The first location needs additional operational and marketing support, while the second location may be a candidate for closure or relocation.

What is a portfolio audit in location optimization analysis?

A portfolio audit is Buxton's classic advanced location optimization analysis. The audit uses your Buxton site score model to score all of your open locations then compares the score to the actual performance. The result is a graph that classifies your locations into four categories that help you to quickly prioritize which locations warrant additional investment or attention, which locations may be candidates for closure or relocation, and which locations represent best practices you should study to replicate across your network.

How does location optimization analysis integrate with customer personas?

One version of Buxton's location optimization analysis uses your customer personas to help you make customer-centric decisions about each location. In this version of the analysis, Buxton defines your customer personas, maps households that match that profile, then identifies the dominant persona for each of your locations. This gives you crucial customer insights to use when evaluating your locations. For example, if a location is located in an area without much customer potential, it will likely always struggle and may be a candidate for relocation. If a location is in a good area but isn't meeting expectations, your team can design marketing campaigns based on the dominant persona for that location to try to drive traffic.