Take Data-Driven Marketing to the Next Level
Marketing Intelligence Solutions
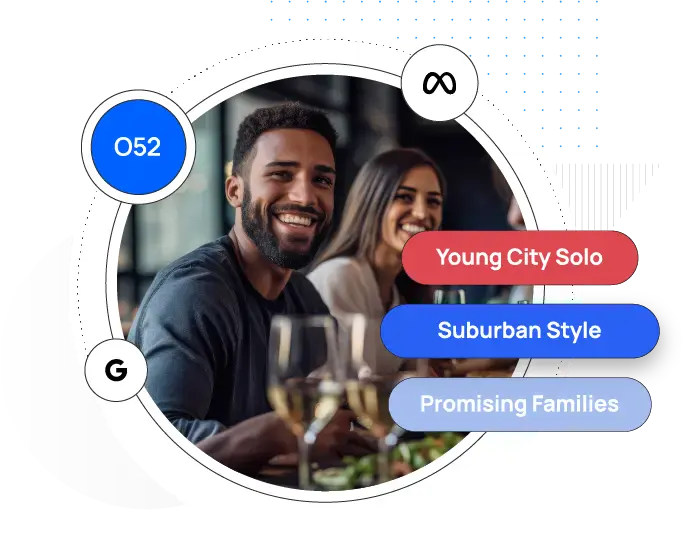
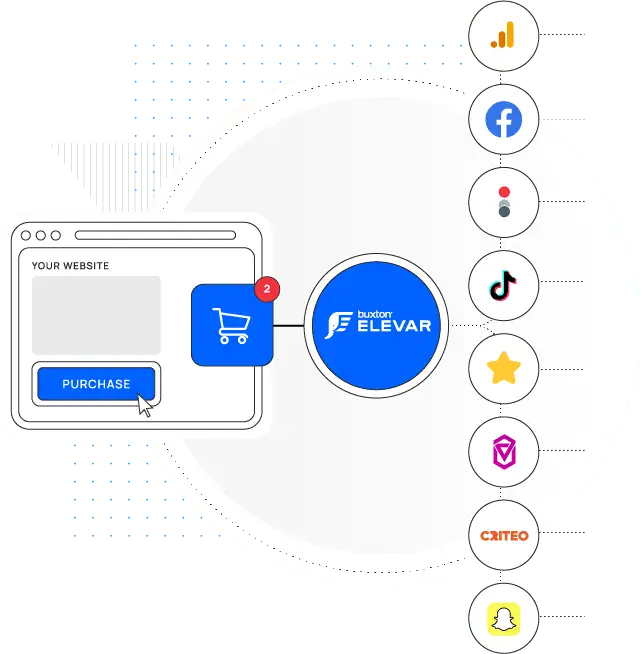
Enhance the efficiency and effectiveness of your marketing campaigns with Buxton’s marketing intelligence solutions. Use powerful insights to gain a full picture of your customer and power your target audiences, key channels, best offers, and more.
Get a Demo