Buxton: Consumer Intelligence Technology

Automotive

To make smart growth decisions, you need to reduce risk, optimize growth and improve your return on investment capital. The Buxton Solution can help you do this by identifying the right location and your best customers to expand your market.

Speak to an Expert

Customer-Driven Location Intelligence

Buxton helps you confidently
grow your business.

How do I avoid making an expensive mistake when choosing my location?

How do I improve return on investment capital (monetary and human) to optimize growth?

How do I understand who my best customers are?

Where are more of my best potential customers?

Buxton By the Numbers

Buxton combines massive amounts of data and makes it useful and actionable.

600+
Unique Datasets
120M+
Households with with up to 8 people per house
2B+
Daily GPS pings
71
Unique customer segments
30M+
Devices tracked daily

Forecast Location Performance

Trade Area Analysis

Know exactly WHERE to grow your locations.

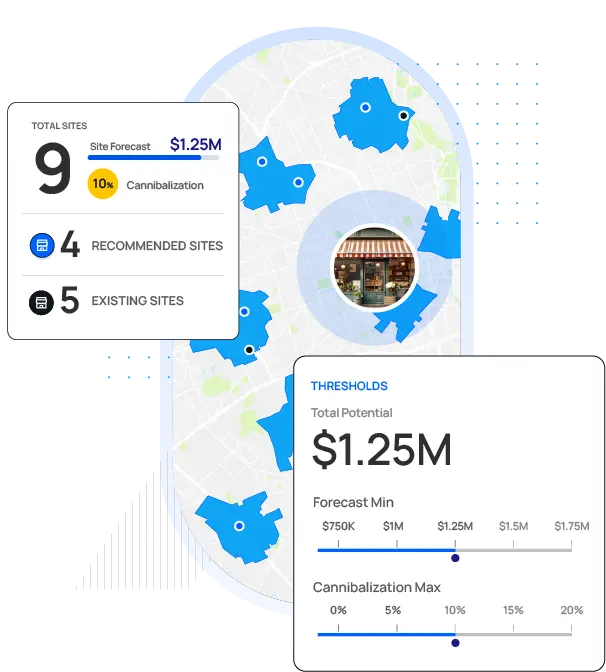
  • Buxton identifies the best potential trade areas, and focus areas so you can open home run locations in any market, maximizing ROI, and avoiding underperforming locations.
Potential Location
545 Main Street
Revenue Forecast
$2.54M
A-
Brand Rank
63/228
Drive Time
16 Min
Cannibalization
Low (1.87%)

Site Selection & Forecasting

Use key metrics and predictive analytics to inform decisions.

  • Location and customer insights reveal the potential of any location based on the unique factors that drive your organization's performance.
  • Use Buxton’s predictive modeling to forecast visits, revenue, cannibalization and more.

Optimize Markets

FORECASTED LOCATION VISITS ACTUAL LOCATION VISITS STUDY GROW OPTIMIZE RELOCATE

Portfolio Analysis

Improve the performance of your existing portfolio.

  • Get a deep understanding of the underlying factors that influence location performance.
  • Increase the value of your real estate portfolio by identifying under-performers, and pinpointing existing properties for relocation.

Potential Analysis

Score and identify the potential of every market in the U.S.

  • Know exactly how many locations you can have, and where they should be located to maximize revenue and minimize cannibalization.
  • Identify new markets that offer the best potential for investment, or find hidden infill opportunities to maximize your current markets and achieve growth objectives.

Identify Your Customers

Primary Customers

Happy wealth old couple.

American Royalty

Affluent, influential and successful couples and families living in prestigious suburbs

11,949
Trade Area Households
4,528
Avg. Trade Area Households
1.3X
Average
Woman boarding a private plane.

Jet Set Urbanites

Upscale singles and couples living high-rise fashionable lives; city-style

8,079
Trade Area Households
3,086
Avg. Trade Area Households
1.2X
Average
Happy family of four

Picture Perfect

Established families of child-rearing households living in wealthy suburbs

7,443
Trade Area Households
3,168
Avg. Trade Area Households
0.9X
Average

Customer Profiles

Use advanced analytics to identify the best potential customers for your organization

  • Go way beyond demographics. Buxton uses 600+ data sets to create in-depth customer profiles specific to your organization.
  • Buxton’s analytics methodologies and proprietary technology define your core customer groups through lifestyle characteristics and spending habits, allowing you to make more informed decisions with insights that matter.
Avatar for Steve Smith
Steve Smith
Gender
Male
Age
38
Income
$100K
Address
10 Elm St.
Vehicle Type
Tesla
Lifestyle
Works out 2x per week, Shops at Whole Foods, Interested in travel
Avatar for Jim Johnson
Jim Johnson
Gender
Male
Age
38
Income
$100K
Address
12 Elm St.
Vehicle Type
F-150
Lifestyle
Eats fast food 3x/week, Shops at Walmart, Sedentary lifestyle

Granular Data

Understand customers and target with more accuracy

  • There are 3,000-4,000 households in an average zip-code. There are 250-500 households in an average block group. Summarized data does not tell the full story. Buxton goes to the household level.
  • Demographically identical neighbors, can have very different lifestyles and spending behaviors. Buxton’s household-level data provides you more accuracy, and more certainty.

Find More Customers

Visitor Insights

Volume
Trade Area
Visitor Origination
Visitor Journey
Return Visitors
Visitor Persona

Look-a-Likes

Know where your best potential customers live, work, shop, and play

  • See home and work locations, at the household-level, of people who look like your ideal customer.
  • Use massive amounts of mobile foot-traffic data to identify where they travel, and when.
3 2 4 5 1

Customer Journey

1
Home Depot
3456 Second Street, Fort Worth, TX 73020
3.4%
2
Target
12 Helvetica Street, Fort Worth, TX 73020
3.2%
3
Quick Trip
964 Plaza Drive, Fort Worth, TX 73020
2.9%

Daypart & Customer Journey

Use travel patterns and customer behavior to know when they’re there

  • Understand your customer’s buying habits by learning which brands they frequent before and after visiting your location.
  • Determine Daypart to understand the demand and potential for any trade area across the country at any time of day.
  • Use traffic volume by time of day and day of week to inform decisions like marketing, staffing, and more.