Healthcare users, this one's for you! You’ll find freshly updated and expanded demand and payor insights in SCOUT map layers to give you even more confidence in navigating a shifting healthcare landscape.
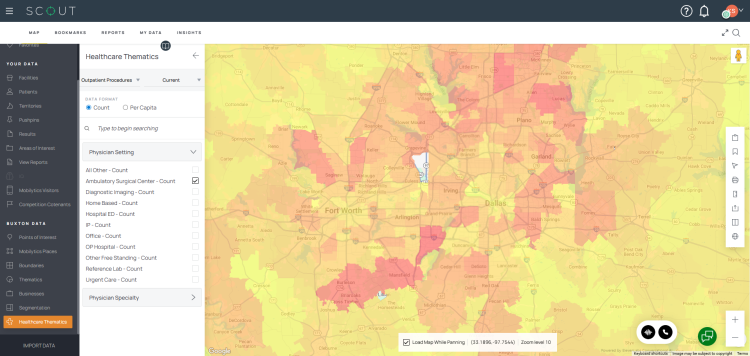
Updated demand insights, now including outpatient procedure demand insights by service line
Understanding demand is a key aspect of location decisions. We're excited to bring you freshly updated demand insights in SCOUT map layers.
As part of this update, we’re also pleased to offer you outpatient procedure insights by service line, in addition to our previously offered outpatient visit and inpatient insights, for relevant service lines.
Does this update include site score models and SCOUT reports? Site score models, including industry site score models, will be refreshed with the updated data at a later date. Soon, we'll also be introducing the ability to run healthcare SCOUT reports that draw from this data using new Buxton-defined templates in our configurable reporting interface.
Why do I see "holes" in the thematic maps? Our demand data is tabulated at the ZCTA level, which does not include sparsely populated areas. ZCTAs were established by the U.S. Census Bureau as a way to tabulate statistical data for ZIP codes. They fluctuate less frequently than ZIP code boundaries.
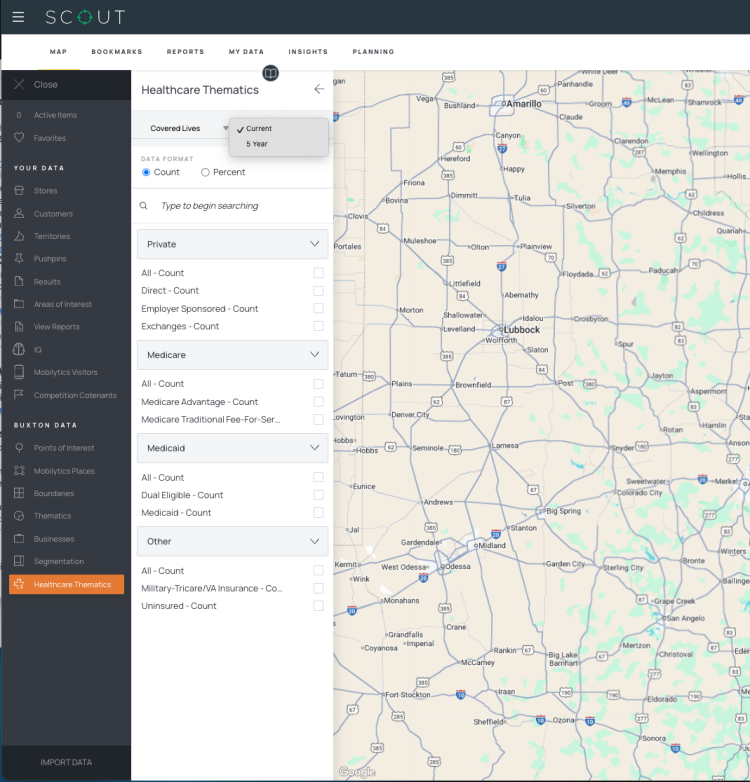
Updated payor (covered lives) insights, now including Medicare Advantage and Tricare/VA payor types
Validating that the reimbursement you need will be present before investing in an area reduces risk. We’re pleased to offer you freshly updated payor mix insights in SCOUT map layers to guide your location decisions.
As part of this update, we’re also expanding our payor types to include Medicare Advantage and Tricare/VA, giving you an expanded coverage view.
Does this update include site score models and SCOUT reports? Site score models, including industry site score models, will be refreshed with the updated data at a later date. Soon, we'll also be introducing the ability to run healthcare SCOUT reports that draw from this data using new Buxton-defined templates in our configurable reporting interface.
Why do I see "holes" in the thematic maps? Our payor data is tabulated at the ZCTA level, which does not include sparsely populated areas. ZCTAs were established by the U.S. Census Bureau as a way to tabulate statistical data for ZIP codes. They fluctuate less frequently than ZIP code boundaries.
Important Notes:
Please note that some Medicare and Medicaid payor types have changed, and we’ve automatically updated your favorited payor thematics to match to the closest equivalent.
Medicare and Medicaid revisions:
- Medicare – Standard and Dual Eligible have been replaced by Traditional Fee-for-Service and Medicare Advantage
- Medicaid – Pre-Reform and Expansion have been replaced by Medicaid and Dual Eligible
Our complete list of payor categories and types is now as follows:
- Private (Direct, Employer Sponsored, Exchange, All)
- Medicare (Traditional Fee-for-Service, Medicare Advantage, All
- Medicaid (Medicaid, Dual Eligible, All)
- Military (Tricare/VA, All)
- Uninsured
If you previously favorited a payor thematic map layer for a payor type that is no longer supported, we have automatically updated it to the closest equivalent.
- Medicare Dual Eligible remapped to Medicaid Dual Eligible
- Medicare Expansion remapped to Medicaid
- Medicaid Pre-Reform remapped to Medicaid
- Medicare remapped to Medicare Traditional Fee-for-Service