
Radius rings and demographics have long been the standard way of evaluating trade areas in the commercial real estate industry. But just because that’s how it’s always been done doesn’t mean that’s how it should be done.
Today, the world of commercial real estate is no longer about location, location, location—it’s about customer, customer, customer. The importance of knowing who your tenants’ customers are has never been higher. And to know these customers, you have to know how they think.
This is why it’s time to reevaluate how the CRE industry determines trade areas. Now is the time to move away from radius rings and demographics, and toward drive time trade areas and psychographic data.
Here’s what you need to know.
Location, Location, Location
Though CRE folks have used radius rings for years, this method of defining trade areas doesn’t reflect how consumers think. When a shopper hops in their car to go to the store, they think about how long it will take them to get there, not how many miles they’ll drive. Because of this, drive time trade areas, which measure how many minutes a customer drives on average to reach a location, make more sense than radius rings.
Additionally, tenants have shifted to defining their trade areas with this method, and speaking their language will help you present a more compelling case when leasing vacancies.
Another issue arises when radius rings are paired with demographic data. Though this can be useful, it can also create false positives and other mistakes if the data averages people together.
For example, let’s say a potential tenant targets middle-class consumers, and a neighborhood with a mix of high-income and low-income residents falls into the one-mile radius around a vacant property. If evaluated by income level (demographics) alone, the area would look middle class on average, even though that’s not the case.
Customer, Customer, Customer
Drive time trade areas are great on their own, but they become even more powerful when paired with psychographic data. While psychographics and demographics—the current standard—are similar, they have a few key differences.
Demographics measure a number of census data-like factors about consumers, such as income, education level, and age. Psychographics take this information a step further and analyze a consumer’s lifestyle, or their behaviors, beliefs, attitudes, values, and buying habits, among other things. This means instead of only knowing how much their income is, you’ll understand where they’re more likely to spend it.
Combine this with your tenant’s drive time trade area and you can make a convincing argument for a property.
Drive Time Trade Area and Psychographics in Action
Here’s a real-life example of how drive time trade areas and psychographics work together to create a more complete picture than radius rings and demographics.
In Troy, Michigan, there’s a Walmart and a Target a quarter of a mile apart. They have nearly identical radius rings, which means their consumer bases could be very similar.
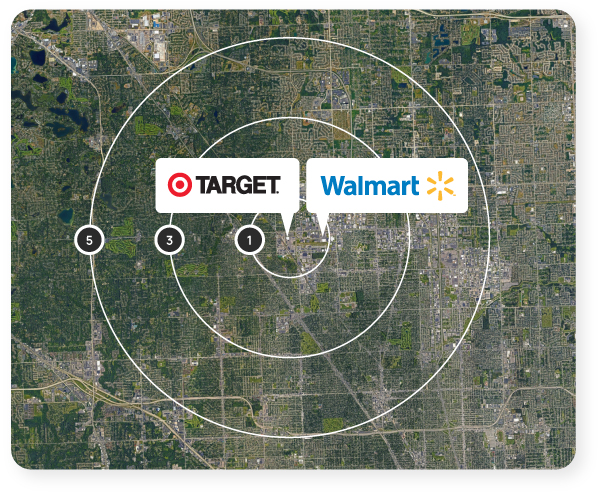
However, anyone who’s been to both stores knows that they cater to different audiences. But who are those audiences? To get the answer, you have to dig deeper than demographics and look at psychographics. Both the average number of minutes traveled and the types of consumers visiting the two stores are different.
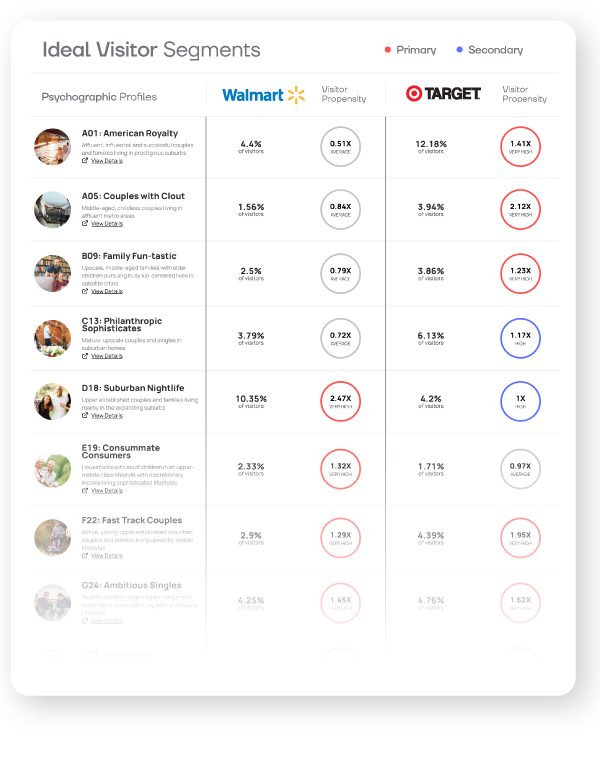
Despite the fact the two stores are so close, their customers are wildly different. For example, even just the first of the Experian Mosaic Segments listed—A01: American Royalty—shows how different the consumers at the Target and the Walmart are. A01 makes up 12.18% of this Target’s customer base compared to the 4.4% of this Walmart’s base.
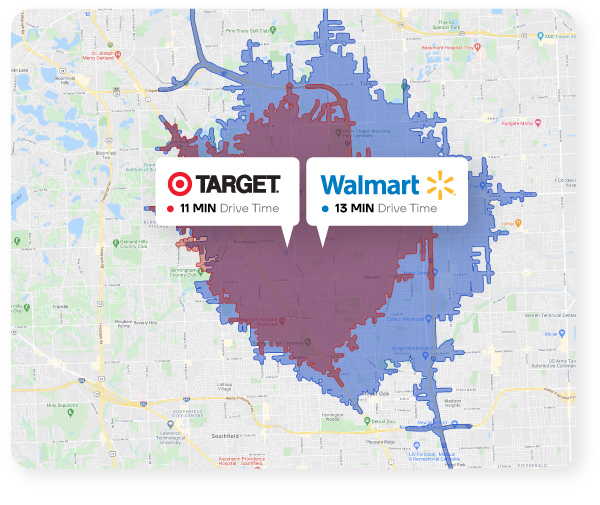
Looking at drive times, this difference becomes even clearer. While 75% of Target’s customers drive an average of 11 minutes to reach the store, Walmart’s drive farther. Two minutes farther, to be exact.
Knowing information like this—who’s coming to a property and how long they’re willing to drive to get there—will help you show a tenant that a property is the right match for their business.
The Bottom Line
Drive time trade areas and psychographics work better than radius rings and demographics to evaluate a trade area. Using this method will help you think like your tenants and their consumers, which will ultimately give you an edge over the competition.
Want to learn more about mobile data and psychographics? Explore Mobilytics, Buxton’s proprietary household-level psychographic data software.

