Put Customers at the Center of Your Strategy
- Acquire more customers that look like your best customers
- Retain and grow your existing customers
- Move before your competitors do


Meet the Platform
Make smarter, data-driven decisions to grow and retain your customer base.
Customer-centric
Make customer-centric decisions with on-demand customer intelligence.
Powerful
Access fast, powerful insights to guide your strategy.
Configurable
Configure the platform to your needs by selecting your package and add-on enhancements.
Find Your Fit
The Buxton Platform is home to a growing collection of SaaS applications designed to help you make the moves that win market share. Our packages grow with you so you can select the option that meets your needs.
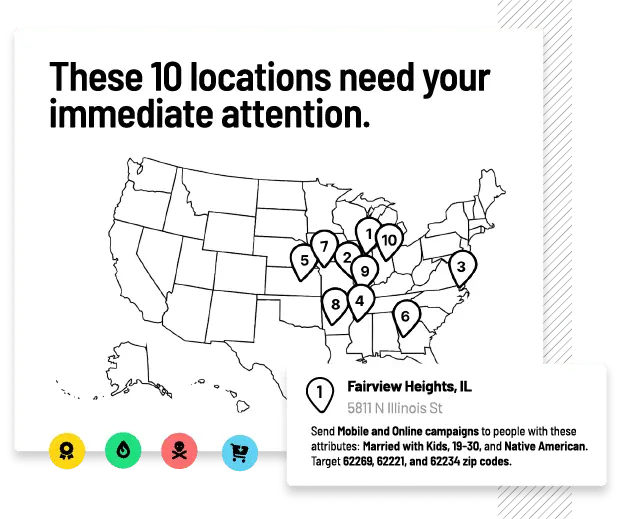
Study Markets With Ease
See where different types of consumers are and get to know markets
Learn More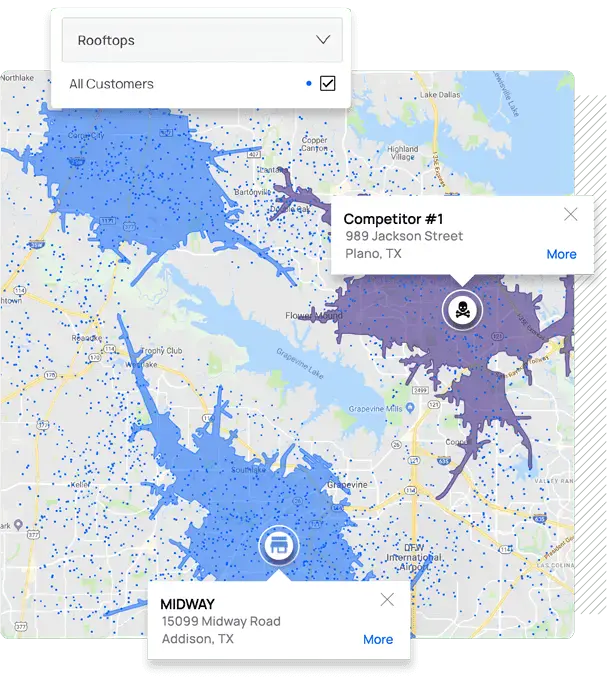
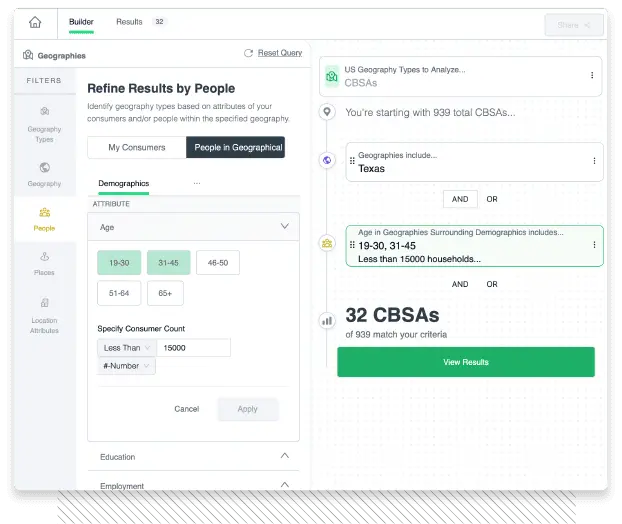
Analyze Your Real Estate Puzzle
Break down site selection decisions into factors that matter
Learn More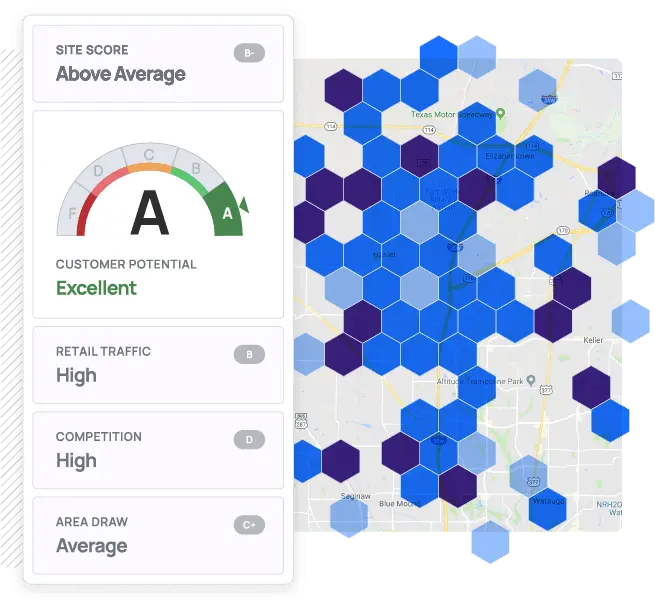
Schedule a Demo
Discover the Essential Customer Analytics Platform

