
Commercial real estate industry professionals are watching this year’s holiday retailing season with interest. Tenant bankruptcies, closures, and other cash flow difficulties have made it a difficult year for retail real estate property owners, investors, and developers. A good holiday shopping season for retailers has important implications for the health of the CRE industry.
The National Retail Federation is predicting that retail sales will be up between 3.6 and 5.2 percent this holiday shopping season. However, many shoppers are expected to replace in-store shopping with online shopping. That begs the question: what role will physical store locations play in this year’s holiday shopping season?
To gauge consumer engagement with stores this season, we analyzed de-identified location analytics data from mobile devices observed at stores and malls on Black Friday, which occurred on November 27, 2020, and compared it to traffic data from Black Friday 2019. While Black Friday has experienced declining traffic for several years and retailers opted to extend their traditional Black Friday sales throughout the month of November, we felt that understanding consumer traffic on that day could provide interesting insights into consumers’ willingness to visit stores this season.
Here’s what we found.
Mall Foot Traffic Declines but State-Level Differences Surprising
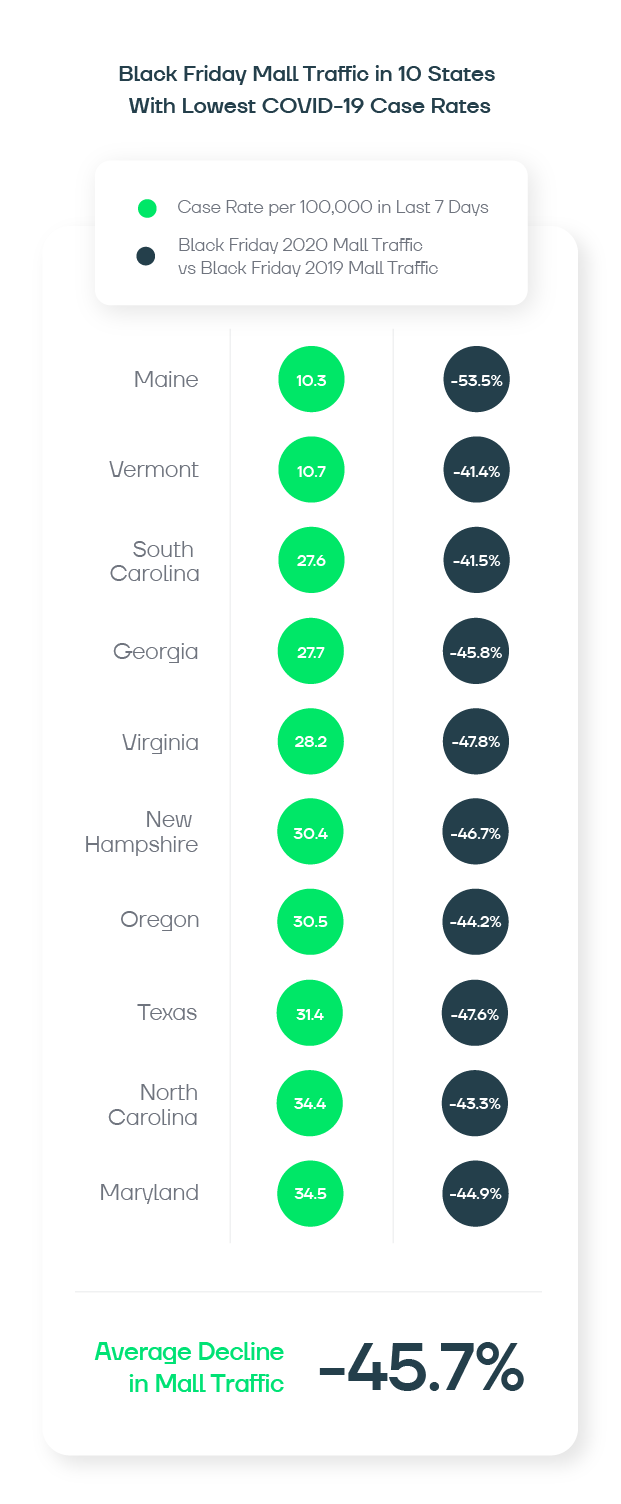
On average, consumer visits to malls on Black Friday declined 44.8% across the continental U.S. But was this same impact seen across all states, or were some states affected more than others?
In theory, consumers in areas of the country with high COVID-19 case counts may be more cautious about visiting malls this season. Consumers in markets with a lower likelihood of COVID-19 transmission may feel safer about visiting malls.
To test that hypothesis, we examined visits per active mobile device at regional and super regional malls across the continental U.S. by state. We combined that data with data from the CDC’s COVID data tracker.
Interestingly, the data revealed a different trend. On average, the decline in mall visits in the 10 states with the lowest COVID-19 infection rates was slightly greater than the decline in mall visits in the 10 states with the highest COVID-19 infection rates. One possible explanation is that states with consumers who stayed at home for Black Friday also stay home more in general, which has resulted in lower COVID-19 case rates. This consumer behavior may be driven in part by cultural traits and/or by public policies.

Retail Category and Brand Results Vary Widely
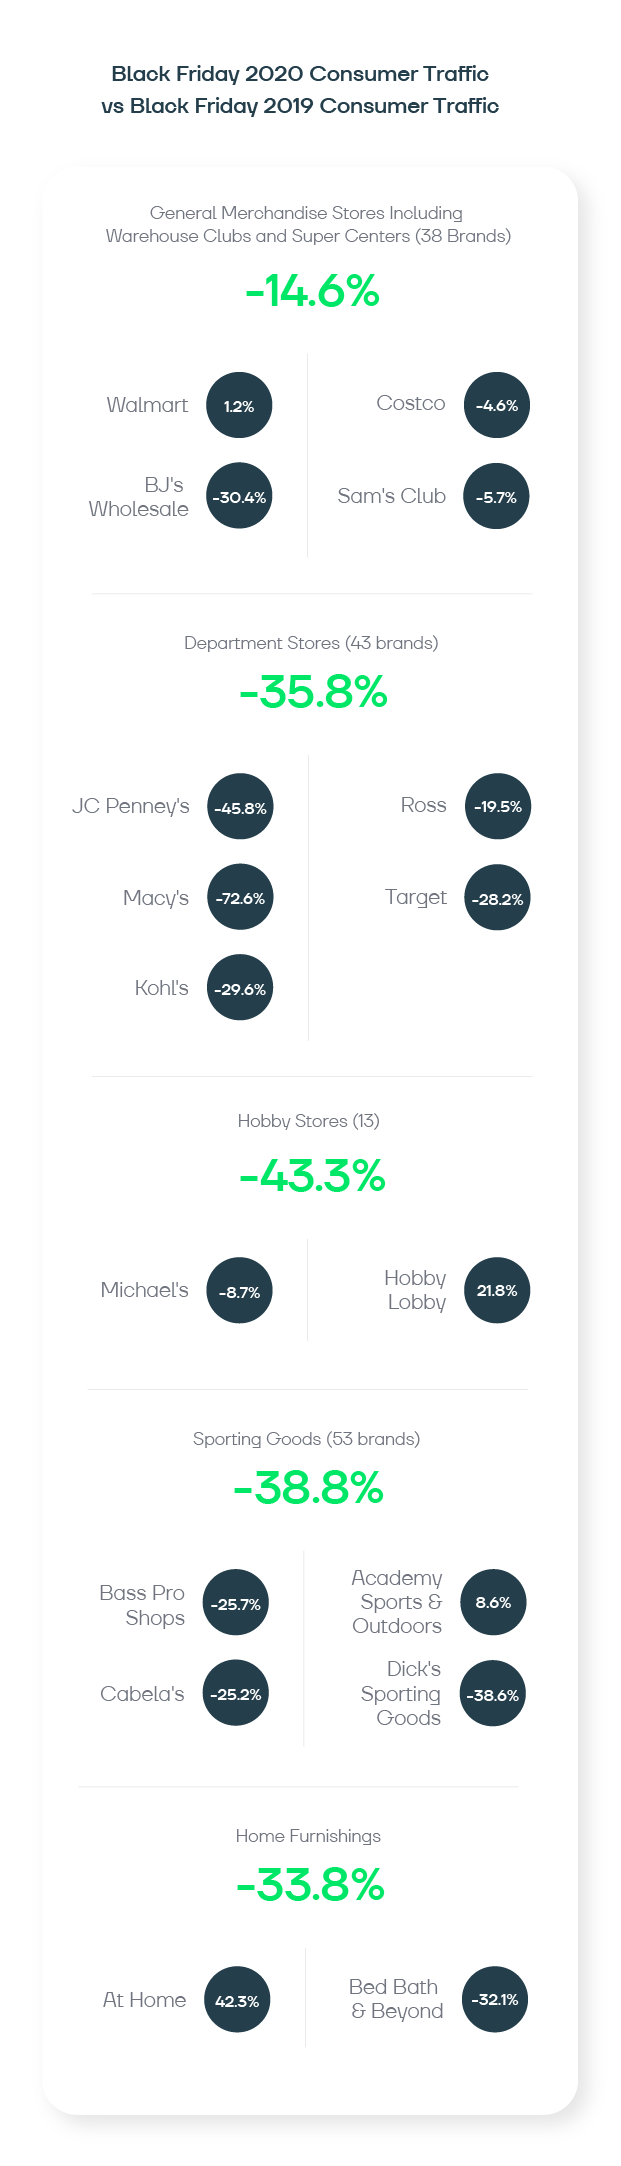
We also conducted a quick audit of consumer traffic changes for certain key retail categories and representative retail brands within those categories. When comparing consumer traffic on Black Friday 2019 to Black Friday 2020, the change in traffic varied widely.
General merchandise stores fared the best, with just a 14.6% decline on average. Walmart, one of the brands included in this category, actually saw traffic rise 1.2% compared to the prior year.
In each category, some brands performed exceptionally well compared to their peers. Hobby Lobby, Academy Sports & Outdoors, and At Home are examples of this. Other brands saw major declines in consumer foot traffic, such as Macy’s and BJ’s Wholesale. This illustrates that while many things have changed, one truth remains the same: you cannot assume that industry averages apply to all brands.
The Bottom Line
Understanding how changing consumer behavior is affecting retailers’ physical store locations can give the commercial real estate industry insights into the role that stores are playing in this new environment. By keeping a pulse on how your properties and tenants are impacted, you can make business decisions informed by data and avoid being caught off guard by unexpected announcements.
Interested in learning more about how Buxton’s location analytics and technology can support your business processes? Explore our new CRE Technology Platform.

